
EudraVigilance--Europe's Vaccine Injury Surveillance System. What's the Damage?
EudraVigilance--Europe's Vaccine Injury Surveillance System. What's the Damage?

Now that the Pandemic Covid Vaccine Rollout, for the most part, is in the rear view mirror, we now have some pretty good data to assess the damage. By damage, I mean specifically the damage that the Covid Vaccines has unleashed on humanity. For this post we will look at probably the most extensive vaccine injury surveillance system in the world, the EudraVigilance System in Europe.
The EudraVigilance System is the European database used to track adverse drug reactions. According to their website,
“These reports are used for evaluating the benefits and risks of medicines during their development and monitoring their safety following their authorisation in the European Economic Area (EEA).”
So essentially the program is designed as a monitoring system designed to protect Europeans from harm by evaluating the cost/benefit analysis of any drug/vaccine. Not all European Countries participate in the EudraVigilance program. Here is a quick summary spreadsheet of what I have been tracking through this system. I will explain where and how I got this data.

So for a quick summary, as of June 12, 2023, here is what we have.
5,373,999 Injury cases
2,358,260 serious injury cases
51,146 cases which were fatal, someone died
You can see that based on these numbers, the Covid Vaccines have created some massive damage. Remember these numbers are only for Europe, and not all of Europe. It gets worse though, much worse. It is commonly known that all Vaccine Injury Surveillance Systems significantly undercount the real level of injury. Harvard University did a study in 2010 and calculated that only 1% of the real vaccine injury is collected.
I did my own comparison of the EudraVigilance System to the V-Safe system to determine the under-reporting factor (I will explain this later on). I concluded an under-reporting factor of 73.4 (1.36%) for injury reports and 39.1 (2.56%) for serious injuries. When accounting for the under-reporting factor, here is what the real numbers actually look like.
394,677,131 Injury cases
92,152,616 serious injury cases
1,998,608 deaths
So, almost 400 million injury cases, almost 100 million serious injury cases, and almost 2 million deaths!! Those are some pretty massive numbers.
That is from almost 1.2 Billion (1,189,792,219) doses having been given. The number of doses given can be found here.


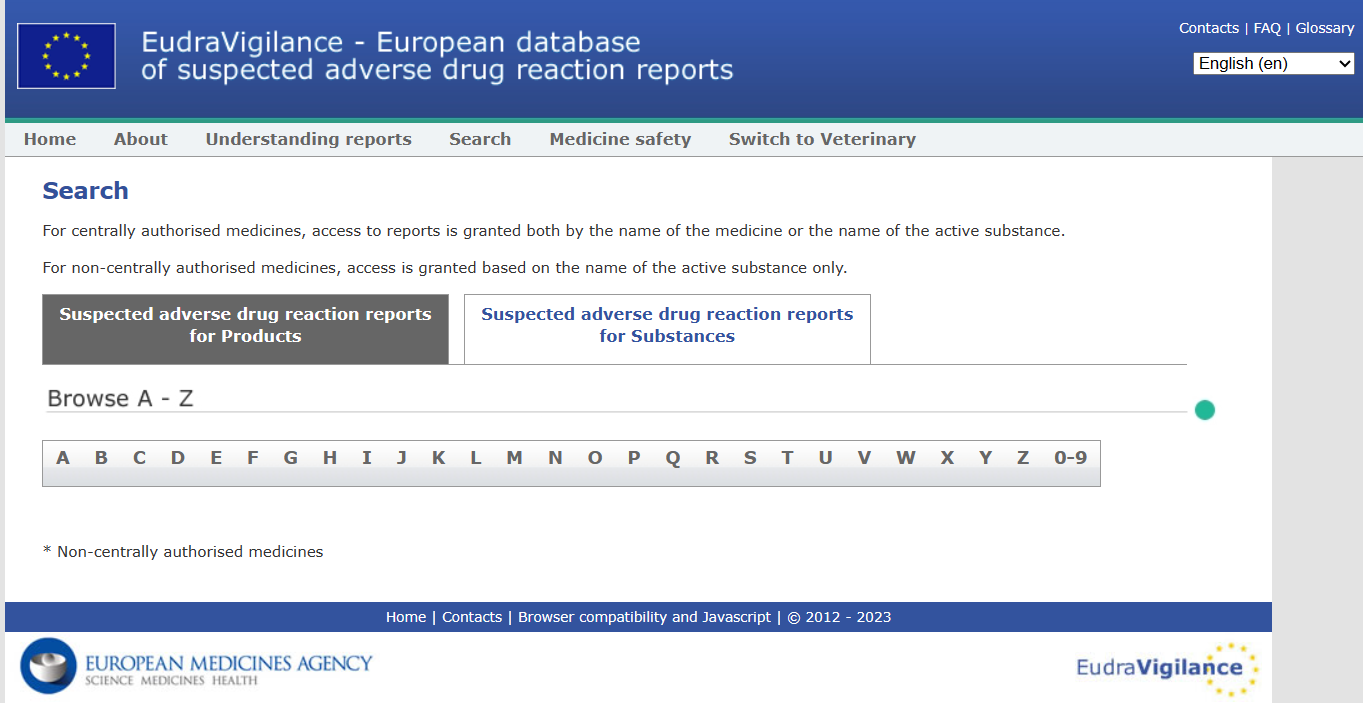
When on the website, you can see the reports for any of the Covid-19 vaccines and checkout the specific adverse events for each vaccine.
If you click on the Pfizer-Biontech (Tozinameran) vaccine you are taken to a page with various tabs, to look at specific information about this vaccine. For instance, you can see the total numbers of adverse event reports by age, the sex, and how many reports were by health professionals vs. non health professionals.

You can also pull up a chart that shows a list of reports by the type of reaction they produced. If you access the Pfizer-Biontech you can see the wide variety of reaction the vaccine had, and it shows how many were serious vs. non-serious.

Not only can you determine how many adverse reaction cases there have been, you can find out how many were fatal (people died). It doesn’t total up the fatalities for all reactions, so you need to enter them in a spreadsheet to total them up.

I have been tracking the data for total injury reports, serious injury reports, and deaths a few times a year to stay up to date. Here is my spreadsheet.

Notice what we see here.
We see high levels of cardiac disorders, gastrointestinal disorders, infections & infestations, musculoskeletal disorders, nervous system disorders, psychiatric disorders, reproduction disorders, respiratory disorders, vascular disorders, and many other disorders.
These Covid Vaccines are showing adverse reactions where almost all parts of the body are effected.
How can any health professional, Public Health officials, or politicians say these vaccines are safe?

What else do we see from this Chart?
If you divide the number of doses by the injury reports, serious reports, and deaths, you can calculate the rate per dose. Here’s what it shows.
Injury rate—451.7 per 100,000 (1 in 221)
Serious injury rate—198.2 per 100,000 (1 in 505)
Death rate—4.3 per 100,000 (1 in 23,256)
As mentioned above, these numbers are lower than the reality as most vaccine injuries are not reported. To determine the numbers closer to reality, we need to calculate the rate of under-reporting to calculate an under-reporting factor.
Even without applying the under-reporting factor, have any Health officials said 1 in 221 are injured from the vaccine, 1 in 505 is seriously injured, or 1 in 23,256 die?
No, all we have heard is the Covid vaccines are safe & effective. These numbers are easily accessible for any health professional as I have shown with links.
 VAERS | Monitoring ...")
Also notice which vaccines had the highest reaction rates?
rate per 100,000
Astra-Zeneca—injury rate 1093.7, serious injury 515.4, death rate 7.86
Pfizer/Biontech—injury rate 410.2, serious injury 177.9, death rate 3.55
Moderna—injury rate 469.7, serious injury 187.5, death rate 6.61
J & J—injury rate 282.6, serious injury 124.1, death rate 5.16
Novavax—injury rate 34.2, serious injury 10.2, death rate 0.06
While none of these covid vaccines showed to be safe, the worst appears to be Astra-Zeneca and the one with the fewest injuries was the Novavax.
Note though that the Novavax numbers are based on a much smaller rollout, though still 13 million doses.
Let’s calculate the under-reporting factor?
For a variety of reasons, vaccine injury is highly under-reported. Most don’t connect the injuries they experience with the vaccine. Most doctors don’t talk about the downside of the vaccines as they can be blacklisted and potentially lose their license for questioning the safe & effective narrative. Also, doctors don’t get paid to do the reports, and the reports take a lot of time to complete. Many doctors just don’t have the time to do them. Also many doctors don’t even know there is a system to report vaccine injury. All of this & more contribute to the under-reporting.
The most highly reported Vaccine Injury Surveillance system so far has been the V-Safe program run by the CDC. At the beginning of the Covid vaccine rollout, the CDC tracked those who received the shots. The vaccinees regularly reported their side-effects through an app. For a further details on the V-safe program see my post.
On to the numbers
The V-safe program involved over 10 million people and found
injury rate—33.2%
medical care needed (serious) injury rate—7.7%
Using these V-safe numbers and comparing them to the EudraVigilance numbers we can calculate the under-reporting factor of EudraVigilance.
Injury Rate Under-Reporting Calculation
EudraVigilance rate of injury—451.7 per 100,000
V-Safe rate of injury—33.2% or 33,172 per 100,000
Under-reporting factor = 33,172/451.7 = 73.4
Serious Injury Rate Under-Reporting Calculation
EudraVigilance rate of serious injury — 198.2 per 100,000
V-Safe rate of seeking medical help (serious injury)—7.7% or 7,745 per 100,000
Under-reporting factor of Serious injury = 7,745/198.2 = 39.1
Note that this shows that serious injuries show a higher level of reporting, which make sense as serious injuries are more noticeable and would receive more attention.
When you apply the Under-Reporting factors to the EudraVigilance numbers you get the numbers presented above. Note, for deaths I am using the serious injury under-reporting factor.
394,677,131 Injury cases
92,152,616 serious injury cases
1,998,608 deaths
So again, almost 400 million injury cases, almost 100 million serious injury cases, and almost 2 million deaths!!
And these are only part of Europe. Those are some pretty massive numbers.
If we look at this in terms of Percentage & Per Person here is what you get

So when accounting for the Under-Reporting Factor (URF) you get:
Injury Rate = 33% or 1 in 3
Serious Injury Rate = 7.75% or 1 in 13
Death Rate = 0.17% or 1 in 595
If you knew those stats prior to vaccination, would you get vaccinated?
Safe? I think not. This is carnage!!
This is simply undebatable. The numbers speak for themselves.